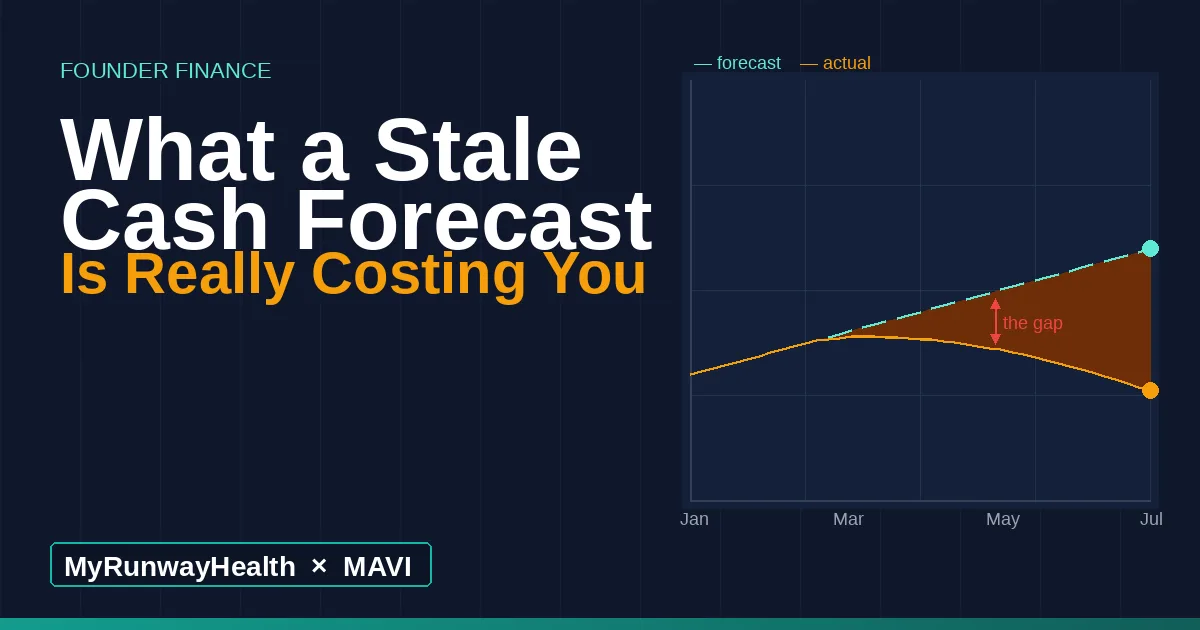
The Numbers That Look Fine Until They Don't
The most expensive financial problems don't announce themselves. They look fine for months, then suddenly don't. A look at the four patterns that reliably mislead growth-stage founders, why they're so hard to spot, and how to build earlier warning systems before a crisis forces the question.
A guide to the financial patterns that are systematically reassuring — right up until they're not.
The specific texture of a problem you didn't see coming
The most expensive financial problems don't announce themselves.
If your bank account drops below the minimum overnight, you find out immediately. If a major customer cancels and your ARR falls by 20%, it's in the dashboard before the end of the day. These are the dramatic surprises — acute, visible, addressable.
The financial problems that actually undo growth-stage companies more often look nothing like this. They look fine for a long time. Not great, not worrying — fine. And then, in a particular month, a particular quarter, a particular decision that gets made at the wrong moment, they don't look fine anymore. And by then the window to respond cleanly has often already closed without a really, really expensive repercussion.
We work with early-stage founders, and a number of finance professionals who support them, and the "numbers that look fine until they don't" pattern is one of the most consistent things we hear about. Not because these companies are being reckless. Not because anyone is deceiving themselves. But because there are specific financial patterns that are structurally designed to be reassuring right up until they're not — and most lean finance teams don't have the bandwidth to catch them.
This piece is about those patterns: what they look like, why they're hard to see, and what it actually takes to catch them before they become a crisis.
The four patterns that reliably mislead
These aren't the only ones. But they're the ones we see most consistently across companies at the $1M–$15M stage — where the finance function is often one person, a part-time bookkeeper, or a founder with a QuickBooks login and good intentions.
1. Revenue recognition timing that drifts from cash reality
In most accounting systems, revenue gets recognized when earned, not when cash arrives. For companies with any kind of contract, subscription, or invoice-based model, this creates a gap. The gap is small at first. It's completely manageable. But as the business grows and the contract mix gets more complex, the gap can widen in ways that make the P&L look healthier than the cash position warrants.
The tell is when a founder says "we had a great month" — and they mean revenue — in a month where cash actually dropped. Not dramatically. Just more than you'd expect for a good month. When this happens once, it's timing. When it happens three months in a row, it's a pattern that's quietly rewiring how you understand your financial position.
2. Accounts receivable that's "aging but fine"
AR aging is one of the most reliably misleading reports in a small company's financial stack. Not because it's inaccurate — it's usually accurate — but because aging AR has a social gravity to it. You know the customer. You've been working with them for two years. They're a little slow sometimes. They always pay eventually.
The problem is that "always pays eventually" is a statement about the past. It's not a forecast. And in the meantime, aging AR is real cash you've earned that isn't in your account, sitting in a bucket that looks like a receivable but functions like a loan you gave without intending to.
When the customer who "always pays eventually" doesn't — because their business got tight, because a decision-maker was travelling, because their own cash position shifted — the AR line doesn't look like a problem until the payment is genuinely overdue. By then you've been building your own cash forecast on that receivable for months.
3. Payroll-to-revenue at the edge of sustainable
This one is insidious because the ratio can look fine for a long time, and then shift very quickly. A company at 55% payroll-to-revenue feels fine. A company at 62% is starting to get uncomfortable. A company at 70% is in trouble — but the move from 55% to 70% can happen across four or five hiring decisions over 18 months, each of which individually looked justified.
The reason founders miss this pattern isn't that they're not watching the payroll number. They are. It's that they're evaluating each hire decision in isolation, against a revenue trajectory that assumed everything else stayed constant. The payroll-to-revenue ratio tells you the aggregate picture. Most hiring decisions get made at the margin.
4. Expense categories that drift month-over-month
Software. Subscriptions. Contractor hours that were supposed to be temporary and are now functionally permanent. Travel that got approved once and became a precedent. Professional services that expanded scope.
None of these categories go from zero to catastrophic overnight. They drift. And because they drift, they don't trigger the kind of scrutiny that a single large unexpected expense would. The GL line items look normal. The categories are where they should be. The total is just slightly higher than last month, which is slightly higher than the month before, which has been true for eight months now.
The compound drift in expense categories is one of the quietest financial risks in a growing company — and one of the hardest to surface without someone who's specifically looking for it. What often makes it more difficult is when you're expecting the increases because you're trying to grow. The adage of "you have to spend money to make money" is true in the growth-stages, but can also lead to ruin.
Why these patterns are structurally hard to catch
It would be easy to read the above list and think: these are all just monitoring failures. Set up better alerts. Look at more dashboards. Check in on the ratios more frequently.
That's part of the answer, but not the whole one.
The deeper reason these patterns are hard to catch is that they're designed, by their nature, to blend in with normal growth. A business at $5M ARR that's growing 40% year-over-year will see revenue recognition timing shift. Will have AR that ages as the customer base diversifies. Will hire faster than its expense categories can be perfectly calibrated. These aren't signs of dysfunction — they're signs of growth that we're expecting.
The problem is that growth and the early stages of financial deterioration look nearly identical from the outside. Both involve increasing complexity. Both involve categories that are moving. Both involve ratios that are drifting in ways that can be explained by the narrative you're using to run the company.
Catching the difference requires a specific skill: the ability to look at a set of numbers that are telling a coherent story and ask whether the story is real, or whether it's just coherent.
Most founders are very good at building coherent narratives. That's a feature, not a bug — it's what lets you raise money and recruit and sell. But it's a liability when the coherent narrative is the thing standing between you and the financial signal you need to see.
"There's a pattern our candidates describe so consistently it's almost a checklist item now. The revenue number looks healthy, the expenses seem in line, and then they pull the AR aging by customer and find two or three names that have been quietly slipping for months – accounts the team knows well enough to trust, but that are now carrying balances that change the actual cash picture significantly. The aggregate always looks cleaner than the detail. That's usually the first thing a strong accounting hire finds, and it's almost never what the company expected them to find."
— MAVI
The gap between what founders know and what's in the books
Let's be honest about what's actually happening in most lean finance teams at the $2M–$10M stage.
The founder is smart. They look at their numbers regularly. They have a feel for the business — where revenue is coming from, what the cost structure looks like, how the quarters tend to play out. That feel is real and valuable.
But a feel for the business is not the same as a forensic read of the books.
There's a specific layer of financial detail that lives between the high-level dashboard view and the raw transaction level — the layer where the drift lives, where the patterns accumulate, where the "numbers that look fine" actually start to shift. It's the accounts receivable aging with customer-level breakdown. It's the month-over-month expense variance at the line-item level. It's the payroll-to-revenue trend across eight quarters. It's the revenue cohort behavior that the aggregate number is blending together.
Most founders see the aggregate. Most bookkeepers capture the transactions. The layer in the middle — interpretation, trend analysis, pattern recognition across financial categories — is the gap.
This isn't a criticism. It's a structural reality of the growth-stage finance function. There aren't enough hours in a founder's week to do everything (believe me, I've tried), and detailed forensic financial review tends to be the thing that slides. Especially when the numbers look fine.
What expertise catches that automation doesn't
There's a version of this problem that technology is solving, and we're genuinely excited about how far financial tooling has come for small businesses. Automated categorization, cash flow projections, variance alerts — these are real improvements over the spreadsheet-and-GL-export approach most companies still rely on.
But there's a category of financial pattern that tools surface and humans interpret — and the interpretation is where most of the value lives.
An accounts receivable aging report shows you that a customer is 60 days past due. What it doesn't tell you is whether that customer has historically been slow but reliable, whether they're showing other signs of distress in the market, whether the specific contact who used to process your invoice has left and the new one hasn't been properly briefed, or whether this particular aging is the leading edge of a churn event that hasn't shown up in your revenue numbers yet.
A payroll-to-revenue alert tells you the ratio crossed a threshold. What it doesn't tell you is whether the hiring decisions that drove it were structurally justified by a pipeline you actually believe in, or whether they were made on an optimistic revenue forecast that's now three months stale.
The tools give you the data. Expertise gives you the interpretation. Both are necessary. And the expertise gap — the distance between the data your system is surfacing and your organization's capacity to interpret it correctly — is exactly where "the numbers that look fine until they don't" lives.
"The difference between a candidate who keeps the books in order and one who actually changes the business is pattern recognition across time. A good hire closes the month accurately. A great hire notices that the payroll-to-revenue ratio has moved eight points over six quarters, that one customer segment's AR is aging differently than the others, that an expense category that was supposed to be one-time has now recurred four months running. They're not just recording what happened. They're reading what the numbers are trying to say before it becomes a problem the CEO has to manage."
— MAVI
Building earlier warning systems
The goal isn't to turn every founder into a forensic accountant. It's to shrink the gap between when a problem starts and when you have enough signal to act.
A few things we've seen work consistently:
Ask the uncomfortable question regularly. Once a month, in whatever financial review process you have, build in a version of the question: "What would have to be true for these numbers to be wrong?" Not as an anxiety exercise — as a discipline. If revenue recognition looks healthy, what assumption is baked in there that could shift? If payroll-to-revenue looks manageable, is that based on a revenue forecast you actually believe?
Build the watchlist before you need it. Pick three or four of your most significant customers and look at their AR aging specifically, every month. Pick two or three expense categories that have historically drifted and check variance explicitly. The goal is to build the habit of looking at the right things before a crisis makes you look at them.
Invest in the middle layer. Whether that's a fractional CFO, a skilled accounting hire, or a VP of Finance who comes in part-time — the investment in someone whose job is specifically the interpretive layer of your financial data pays back faster than almost anything else at this stage of growth. Not because they'll catch every problem. Because they'll catch the pattern early enough that you have options.
Use scenario modeling before decisions, not after. The "numbers that look fine until they don't" problem is often a scenario problem: you're seeing the baseline, not the downside case. Running the scenario before the decision — what does the payroll-to-revenue ratio look like if revenue comes in 15% below plan? what does AR aging look like if one of the top five customers slows down? — brings the risk forward in time, when you can actually do something about it.
Common questions we hear on this
How do I know if my numbers are in this category?
The honest answer: if your financial review process mostly involves looking at aggregate numbers and confirming the trend is directionally right, you're probably in this category. The "numbers that look fine until they don't" problem lives at a level of detail below the aggregate view.
We have a bookkeeper — isn't this their job?
A bookkeeper ensures your transactions are categorized correctly and your books are compliant. That's valuable and necessary. But a bookkeeper typically isn't doing trend analysis, pattern recognition, or variance interpretation. Those are different skill sets — and the gap between them is real.
Can software close this gap?
Partly. Good financial tools surface the data faster and more reliably, and some are getting better at flagging anomalies. But the interpretation of what an anomaly means for your specific business, in your specific market, with your specific customer mix — that's still human work. The tools and the expertise are complements, not substitutes. It's also worth knowing if that software tool you're considering (or just shelled out for) is for you or for the finance professional you haven't hired yet.
What's the earliest stage where this matters?
Earlier than most founders think. We start seeing these patterns emerge consistently at companies around $1M–$2M ARR, when the financial complexity has grown past what a simple monthly close process can reliably surface. That's also usually before most companies have invested meaningfully in finance talent beyond a bookkeeper.
The bottom line
The numbers that look fine until they don't aren't hiding from you. They're sitting in the same reports you already look at, in the same categories you already track. The problem isn't necessarily visibility — it's interpretation.
The companies that catch these patterns early share two things: a financial tool set that keeps the GL data and forward-looking cashflow current and accessible, and someone with the expertise to ask the right questions of that data before the questions become urgent.
If you're not sure which category you're in, the answer is probably the same: invest in the tools first, and if the answers aren't apparent to you, then bring in the talent and don't wait for something to look obviously wrong to find out.
MyRunwayHealth gives early-stage founders and finance teams real-time cash flow visibility and scenario modeling — the tools that surface the patterns before they compound. Start your free 7-day trial →
MAVI connects growth-stage companies with pre-vetted accounting and finance talent — the people who know the difference between a compliant close and an insightful one. *Learn more at *maviwork.com* →*